Linear Fit
Linear Fit performs a linear least-squares fit on a user-defined region of data, and adds the resulting line as a trace on the chart. In order to use this command, a region must be specified on the Active trace.
Method:
- Make the trace on which to fit a line the Active Trace. Do this by right-clicking on the trace and clicking Activate Trace.
- Select a region on this trace using either the mouse or keyboard curve selection tools,
 .
.
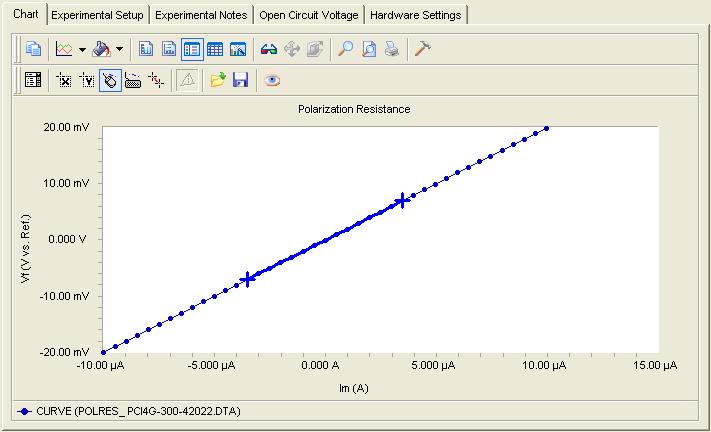
- After you select the region, click the Linear Fit command on the document menu. The algorithm begins to fit a line to the selected region. When the fit is complete, a new trace is added to the chart.

- View the equation for the new line by moving the mouse cursor over the line and watching the tool-tip.