In addition to normal Cyclic Voltammetry tests, the Raman Cyclic Voltammetry experiment allows you to perform CV and spectroscopic measurements simultaneously.
See the Spectroscopy help section for definitions, parameters, and commands for the spectroscopic part. For additional information about setup parameters and commands for corresponding electrochemical experiments, see the Physical Electrochemistry help section.
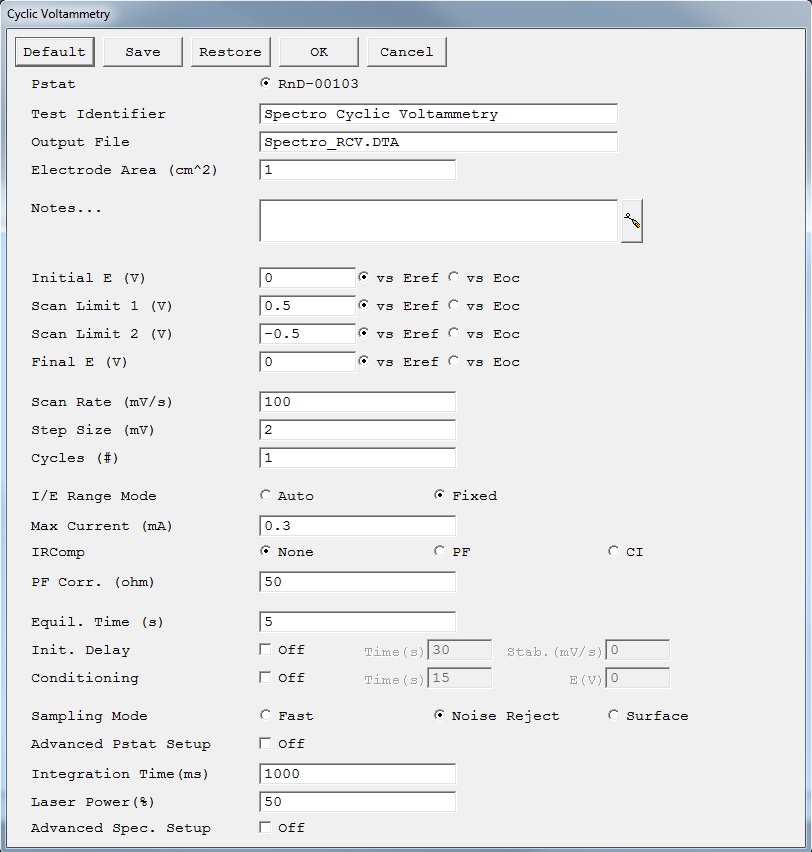
The main Raman Cyclic Voltammetry window is:
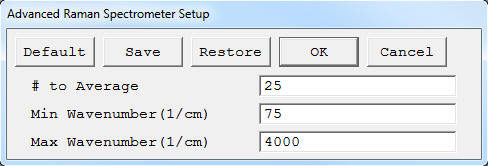
The Advanced Raman Spectrometer Setup window appears if you activate the Advanced Spec. Setup checkbox:
Parameters for these two windows are:
| Laser Power (%) | See Raman Spectroscopy |
| Integration Time | See Raman Spectroscopy |
| Advanced Spec. Setup | Opens setup window for additional Raman settings, if enabled. |
| Integration Time | See Raman Spectroscopy |
| Min Wavenumber | |
| Max Wavenumber | See Raman Spectroscopy |
See the Cyclic Voltammetry experiment for all other parameters.
Run the Raman Cyclic Voltammetry standard technique by selecting the Named Script command under the Experiment menu in Gamry’s Framework™. Opening the Raman Cyclic Voltammetry.exp file initiates the following sequence of events:

a. If you click the OK button, theAcquire Dark Spectrum window appears.
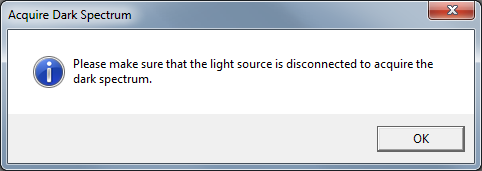
By clicking OK again, a dark spectrum is recorded. The data of the dark spectrum are not saved. The Acquire Blank Spectrum window appears.
![]()
By clicking OK, a blank spectrum is recorded. The data of the blank spectrum are not saved. ARuntime Warning appears.

By clicking OK the actual measurement starts. The previously measured dark and blank spectra are automatically subtracted.
b. If you click the Cancel button, no dark or blank spectra are recorded. For the actual measurement, Raw Counts are measured and plotted versus wavenumber.
If Initial Delay is on, the cell is turned off and the specimen's Eoc is measured for the time specified as the Initial Delay time or until the potential stabilizes to a value less than the stability setting. The last measured potential is recorded as Eoc.
A plot of potential versus time is always displayed. A second window for the spectra shows no plot.
If Initial Delay is off, this step is skipped and Eoc is assumed to be 0.0 V vs. Ref.
The script conditions the electrode if Conditioning was specified in the setup. Conditioning is done by applying a fixed potential for a defined time while the cell is turned on. A plot of current versus time is displayed during Conditioning. The window for the spectra shows no plot. No data are saved during this step.
Finally the data are acquired. The spectrometer starts to measure spectra. Charge and current readings at fixed time-intervals (Sample Period) are taken during the steps in Spectro Chronocoulometry. Plots of charge and current versus time are displayed during the steps. For the spectra, either Raw Counts, Absorbance, or Transmittance are recorded and plotted versus wavelength.
The potential of the sample is set to Initial E and is held at that value for theEquilibration Time. The potential is then swept from the Initial E to Scan Limit 1, then to Scan limit 2, and then to Final E. If Scan Limit 2 equals Final E then the scan stops at that value. If the number of cycles exceeds one, the potential repeats the sweep for n cycles.
Current readings at fixed voltage-intervals are taken during the sweep. The voltage interval between steps is defined as Step Size in the Setup dialog box. The sweep is actually a staircase ramp. The sample is potentiostatically held at Initial E, a delay of one sample period occurs (sample period = 1/Scan Rate × Step Size), and a reading of the current is taken. The potential is then stepped by a few mV as defined by Step Size, a delay of one sample period occurs and the next current reading is taken. Stepping the potential, delaying, and acquiring data points continues until the potential equals Final E.
If you selectedAutoranging in the setup, the current range is automatically switched to the optimal range for the measured cell-current at each point. If Positive Feedback IR-compensation has been selected, all data are continuously corrected for IR-drop. If Current Interrupt IR-compensation has been selected, each potential is corrected for the measured IR-drop of the preceding point.