EIS and subsequent DRT characterization of a vanadium redox-flow single cell
Authors: Markus Holzweber, Jie Sun and Pavel Mardilovich
Enerox GmbH, IZ NÖ-Süd Straße 3, Objekt M36, AT-2355 Wiener Neudorf, www.cellcube .com
Background
In the pursuit of realizing the energy transition, the integration of renewable energy technologies like wind and solar power with intermediate energy storage is paramount. While lithium battery storage systems dominate the market due to their large-scale production and manufacturing maturity, concerns about safety persist. Incidents of lithium batteries igniting, despite ongoing countermeasures and technological advancements, underscore their inherent vulnerability and raise questions about their sustainability. Compounded by the surging demand for lithium in mobile applications, there is a pressing need for alternative battery technologies that offer safety, reliability, and sustainability.
Each battery technology possesses unique strengths tailored to specific use-cases, temperature ranges, and geographical considerations. For stationary battery applications, non-flammable alternatives such as the vanadium flow battery (VRFB) emerge as compelling options. The VRFB, a thoroughly researched water-based system, boasts globally deployed stationary day storages with an exceptional low environmental impact, as verified by life cycle assessments [1].
Within the VFB, electrical energy undergoes conversion into chemical energy within the cell stack, stored through the separation of reduced and oxidized electroactive species in external tanks (Figure 1: Schematic of a VRFB.). The stack is composed of a number of cells, with each typically featuring an ion exchange membrane separating the negative and the positive half-cell electrodes, while the electrical contact between the neighboring cells is established through bipolar plates. The reaction on both sides involves different oxidation state of vanadium, and is outlined in equations 1 and 2.
Positive Electrode:
VO2+ + H2O - e- → VO2+ + 2 H+ (E0 = 0.99 V vs. SHE) eq.1
Negative Electrode:
V3+ + e- → V2+ (E0 = -0.26 V vs. SHE) eq.2
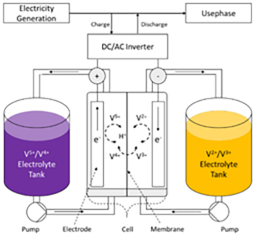
Figure 1: Schematic of a VRFB.
Vanadium redox flow batteries (VRFB) stand out as mature flow battery technologies, distinguished by their low CO2 footprint across the entire life cycle. The efficiency of a flow battery system during charging and discharging hinges to a significant extent on the design of its cell stack and the properties of the materials therein. The electrochemical impedance spectroscopy (EIS) proves instrumental in examining electrode materials within the stack, offering insights into contact resistance, reaction kinetics, and mass transport [2].
By deconvoluting frequency-dependent EIS data into a distribution of time constants through Distribution of Relaxation Times (DRT) analysis, one can discern the contribution of various components to impedance. Equivalent circuits aid in attributing measured resistance to pore resistance, tortuosity of porous electrodes, and kinetic activity at the electrode interface with the electrolyte. This nuanced understanding facilitates the determination of physical properties such as diffusional impedance, charge transfer, ohmic resistance, and mass transport, contingent on the investigated frequency range and flow rate [3] [4].
Moreover, the synergy of EIS with different electrochemical techniques deepens the understanding of materials [5]. This multi-faceted approach, coupled with advancements in flow battery technologies like VRFB, aligns with the imperative of transitioning to safer, reliable, and sustainable energy storage solutions.
Experimental
For all investigations a small standard in-house single cell with an active geometrical area of 20 cm2 (2x10 cm) was used. The cell was assembled with commercially available activated carbon felt electrodes, an anion exchange membrane, and carbon composite monopolar plates contacted with copper current collectors. A commercial H2SO4-based 1.6 M vanadium solution was used as the electrolyte. The single cell was operated on an in-house test set up, which charged the electrolyte to a defined SOC before the EIS experiments and maintained a constant electrolyte flow/pressure and temperature during the EIS experiments.
Full cell galvanostatic EIS measurements were performed on a Gamry Interface 1010E (GAMRY Instruments, Warminster, PA, USA) using an AC amplitude of 177 mA rms with 10 points per frequency decade and zero DC offset at an open circuit potential (OCP) of
a)1.40 V (SOC 45 %) and a frequency range of 105 – 5*10-3 Hz during the experiments at electrolyte pressures of 500 and 750 mbar corresponding to flow rates of 20 ± 1 ml/min and 35 ± 1 ml/min, respectively.
b)1.41 (SOC 51 %) and 1.49 (SOC 80 %) and a frequency range of 105 – 10-1 Hz and an electrolyte pressure of 500 mbar corresponding to flow rates of 20 ± 1 ml/min.
All experimental conditions for the experiments at different flow rates are summarized in Table 1 and Table 2.
Table 1: Experimental conditions for the experiments at constant OCVs and different flow rates.
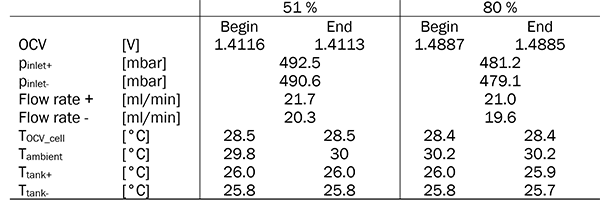
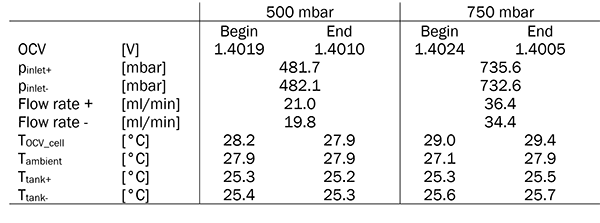 Table 2: Experimental conditions for the experiments constant flow rate and different SOCs.
All EIS impedance measurements were evaluated using Gamry’s Echem Analyst software. The distribution of relaxation times (DRT) analysis was performed using Gamry’s Echem Analyst 2 software. DRT analysis requires linearity and time-invariance of the measured EIS data to provide meaningful results. [4, 6] Therefore, data quality has been checked using Kramers-Kronig transform, and the relative residuals were below 1 %.
Results and Discussion
EIS characterization
The impedance behavior of a single cell was investigated using different electrolyte pump pressures corresponding to different electrolyte flow rates. The equivalent circuit consists of an inductor (L), one resistor (Rhf) to account for the high frequency ohmic resistance, one resistor (Rct) to account for the charge transfer resistance, a constant phase element (CPE) to account for non-ideal capacitance behavior and a porous bound Warburg element to account for diffusional behavior. Figure 2a shows the Nyquist plot and Figure 2b the residuals after a fit to an equivalent circuit shown as inset in Figure 2a, confirming a high quality fit. The results of the fit are summarized in Table 3.
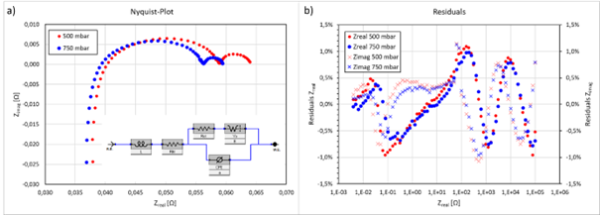
Figure 2: a) Nyquist diagrams of the impedance obtained on a VRFB single cell for two different electrolyte pressures (flow
rates) and b) the residuals of the fit to the equivalent circuit shown as inset in a).
Table 3: Results of the fit to the equivalent circuit in the inset of Figure 2:a for constant OCVs and different flow rates.
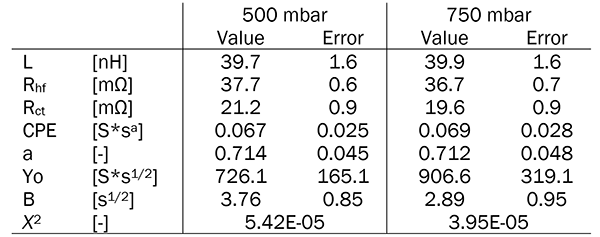
It can be seen in Figure 2a that the high frequency resistance Rhf is slightly offset for different pump pressures. While this difference is small, it is significant, and we attribute it to a better monopole-to-current collector electrical contact due to higher applied pressure. The first semicircle representing the charge transfer resistance Rct of the 750 mbar Nyquist curve appear smaller than the 500 mbar Nyquist curve. However, the fitted values for Rct can be regarded as within error of each other, given the small temperature deviations between the experiments. The second semicircle representing the diffusion phenomena is affected by the different electrolyte pressures or flow rates. In accordance with the literature, only the diffusional impedance is affected by a change of flow rates but not the ohmic resistance Rhf or the charge transfer resistance Rct [4, 7], which we confirm here.
The impedance behavior of the same cell at OCV 1.41 V (SOC 51%) and 1.49 V (SOC 80 %) was investigated at a constant electrolyte pressure (flow rate). The measurements were made in a frequency range of 105 – 10-1 Hz, which excluded most of the diffusional phenomena. Figure 3a shows the Nyquist plot and Figure 2b the residuals after a fit to an equivalent circuit shown as inset in Figure 3a. The residuals are within a 1% deviation band, confirming the high quality of fit. Fitting the equivalent circuit as in the previous experiment proved problematic, since absence of the spectrum characteristic of the Warburg element was absent, and automated fitting gave a high error. For this reason, the porous bound Warburg element was removed from the equivalent circuit for fitting this data. The results of the fit are summarized in Table 4: Results of the fit to the equivalent circuit in the inset of Figure 3 constant flow rate and different SOCs.
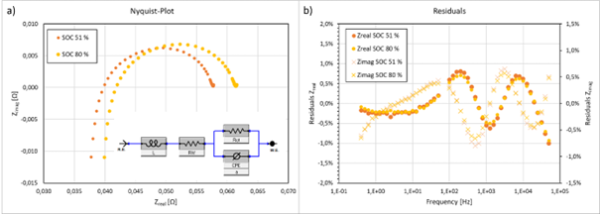
Figure 3: a) Nyquist diagrams of the impedance obtained on a VRFB single cell for two different electrolyte OCVs (SOCs) and b) the residuals of the fit to the equivalent circuit shown as inset in a).
Table 4: Results of the fit to the equivalent circuit in the inset of Figure 3 constant flow rate and different SOCs.
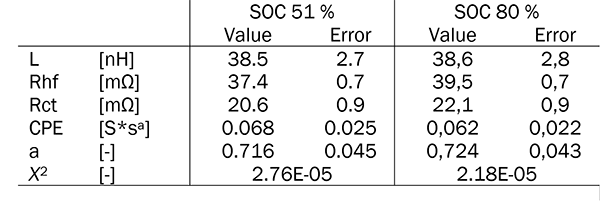
Two distinct features can be seen in Figure 3a by increasing the SOC from 51 % to 80 %. The first is a shift of Rhf by 2.1 mΩ to higher values and the second is a slight increase of Rct by 1.5 mΩ. The increase of Rhf is discussed by Scneider et al. [4] by a process occurring at the membrane. It is proposed that a double layer is formed at the membrane/electrode interface of the positive half-cell. The rise of Rhf is caused by a higher concentration of V(V) species, which lead to an increased blocking of the membrane channels thus increasing Rhf. Since our experiment was performed at a high SOC, which correspond also to a higher V(V) concentration in the positive electrolyte, the observation of a higher Rhf agrees with earlier observations. [4] A change of Rct upon changing the SOC is to be expected from the Butler-Volmer kinetic model. However, the difference in Rct is not significant considering the error of the fitted values. A certain amount of diffusional impedance might also be present in the first semicircle, as will be discussed below.
DRT characterization
The impedance spectra for the two experiments have been subject to DRT analysis. The calculations have been performed using Gamry’s Echem Analyst 2 software. Prior to the DRT analysis the inductance was subtracted from the EIS spectra. A combined fit of real and imaginary part of the impedance was used with a regularization parameter λ = 1*10-8 and a gaussian radial basis function with a FWHM of ε = 2.50. Several peaks are obtained in the DRT representation as shown in Figure 4. Since impedance data is usually discussed in terms of frequency dependence it is more convenient to discuss the DRT results dependent on characteristic frequencies rather than time constants [4]. In contrast to the results from Schneider et al. we have obtained 7 peaks in Figure 4a and 6 peaks in Figure 4b.
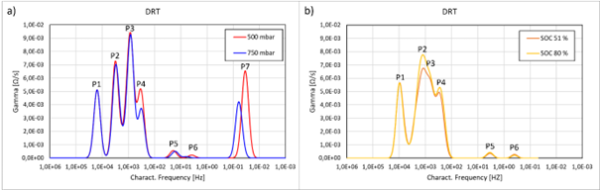
Figure 4: DRT representation of a) electrolyte/flow rate dependent impedance and b) SOC dependent impedance.
The difference between these two experiments is, that the frequency range during the SOC dependence experiment was reduced and the lower frequency diffusion events were not measured. Therefore, the P7 at low characteristic frequency is not present in Figure 4b. In an extensive parameter variation study on full cell and double half-cell experiments a peak assignment was established and is applied to our experiments. The first three peaks (P1-3) are assigned to distributed ohmic resistance (P1), anion exchange membrane (P2) and negative half-cell kinetics (P3) and peaks P4-7 to mass transport. The occurrence of more than one peak related to mass transport is expected, since the DRT of a Warburg element consist of a series of δ-functions [7]. The peak assignment of P4-7 is clearly supported by Figure 4a, where a change of electrolyte pressure/flow rate only affects these peaks. P1-3 however in Figure 4a show no significant sensitivity to a varied flow condition. The DRT results of the experiment at different SOCs Figure 4b show no change in P1, but in P2-4. P2 is a process at the membrane surface on the positive half-cell, as discussed above and by Schneider et al., leading to an increase in Rhf (Figure 3a and Table 4). This can also be seen in Figure 4b where a higher V(V) concentration increases P2. The negative half-cell kinetic peak P3 is also slightly enhanced by increasing the SOC (i.e. change in the V(II)/V(III) ratio) which increases the Rct correspondingly (Table 4). A hindered mass transport to and from the electrode surface can be seen in P4, likely due to changes in viscosity and diffusivity as a function of SOC. Meanwhile P5 and P6 remain unchanged. Since P4-6 are visible in the DRT plot for the SOC-dependent impedance, the presence of diffusional impedance in the first Nyquist semicircle, as assumed above, is reasonable.
Overall, the results of the DRT are in agreement with the work from Schneider et al. An observed difference is the occurrence of a diffusional peak (P4) in a frequency range of 1 kHz-100 Hz. We attribute this to differences in cell geometry.
Bibliography
- Blume, N., et al., Life cycle assessment of a vanadium flow battery based on manufacturer data. Procedia CIRP, 2023. 116: p. 648-653.
- Messaggi, M., et al., Investigation of vanadium redox flow batteries performance through locally-resolved polarisation curves and impedance spectroscopy: Insight into the effects of electrolyte, flow field geometry and electrode thickness. Journal of Power Sources, 2020. 449: p. 227588.
- Landesfeind, J., et al., Tortuosity Determination of Battery Electrodes and Separators by Impedance Spectroscopy. Journal of The Electrochemical Society, 2016. 163(7): p. a1373-a1387.
- Schneider, J., et al., Deconvolution of electrochemical impedance data for the monitoring of electrode degradation in VRFB. Electrochimica Acta, 2020. 336: p. 135510.
- Becker, M. and T. Turek, Combination of impedance spectroscopy and potential probe sensing to characterize vanadium redox-flow batteries. Journal of Power Sources, 2020. 446: p. 227349.
- Schönleber, M., D. Klotz, and E. Ivers-Tiffée, A Method for Improving the Robustness of linear Kramers-Kronig Validity Tests. Electrochimica Acta, 2014. 131: p. 20-27.
- Sun, C.-N., et al., Resolving Losses at the Negative Electrode in All-Vanadium Redox Flow Batteries Using Electrochemical Impedance Spectroscopy. J. Electrochemical Society, 2014. 161(6): p. A981-A988.
Want a PDF version of this application note?
Please complete the following form and we will email a link to your inbox!
Categories