Using Cyclic Voltammetry to Detect Iron Impurities During Water Oxidation Measurements
Authors: Raul A. Marquez and C. Buddie Mullins
Mullins Group, University of Texas at Austin, Austin TX, USA
Purpose of This Note
This application note outlines an electrochemical method using cyclic voltammetry (CV) to detect iron (Fe) impurities in aqueous alkaline electrolytes using nickel (Ni) electrodes. The performance of Ni electrodes towards the oxygen evolution reaction (OER) is not the focus.
The experimental setup and conditions required for this test are described, offering insights for studying the activity of water oxidation catalysts. The method requires the use of Gamry’s sequence wizard. A copy of the sequence is available upon request (.GSequence file).
Introduction
Water electrolysis has received significant attention for its potential to produce green hydrogen. However, OER, a key step in water electrolysis, remains a bottleneck, prompting extensive research on catalysts to accelerate this process.
Studies have revealed that trace Fe impurities can influence the OER activity of Ni-based catalysts in alkaline electrolytes, such as KOH and NaOH. These impurities enhance catalytic activity, leading to misinterpretation of results, low reproducibility, and cross-contamination. This phenomenon is well-documented, and procedures for detecting and removing Fe impurities are available. Interestingly, Ni electrodes, which are highly susceptible to incorporating Fe impurities, can serve as a detection tool when combined with CV.1
During the oxidation portion of a CV experiment, Fe impurities incorporate into the porous oxide/hydroxide film that forms on the Ni electrode. Prolonged CV cycling grows a thick, porous oxide layer and accelerates Fe incorporation. This incorporation enhances OER activity and promotes the formation of the disordered γ-phase of Ni hydroxide/oxyhydroxide. In the absence of Fe, no such enhancement in OER activity is observed. These transformations become increasingly evident in the CV scans as conditioning progresses, which is then used as the basis of detection.
Setup
Figure 1a shows a typical setup for studying OER catalysts in alkaline media. A cell made of polytetrafluoroethylene (PTFE) is recommended to prevent glass etching. A graphite counter electrode and a Hg/HgO reference electrode are recommended when working with alkaline electrolytes.
A Ni foam electrode with a large surface area was used for this study. The electrode was coated with polydimethylsiloxane (PDMS) to isolate the exposed area (typically 1 cm2) and prevent electrolyte capillary action through the porous foam (Figure 1b). The Ti clip connecting the electrode was protected from electrolyte contamination, ensuring accurate measurements during testing.
For a 1 cm2 Ni foam electrode (1.5 mm thick), 2000 CV scans were performed from 0.15 to 0.8 V vs. Hg/HgO at a scan rate of 50 mV·s-1. Here, voltages are reported against RHE.
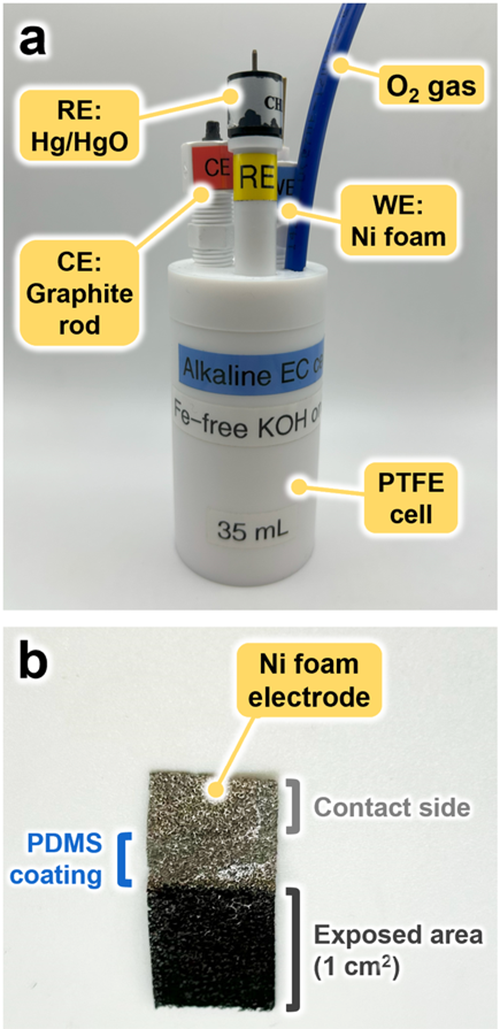
Figure 1: Experimental setup for testing OER catalysts in alkaline media:
(a) PTFE cell and (b) PDMS-coated Ni foam electrode.
iR compensation
All CVs presented here use iR compensation. Applying iR compensation using the positive feedback mode is important when working with Ni electrodes, as detailed in a previous publication.2 Other methods such as current interrupt and post-experiment iR compensation are less reliable.
Results
Figure 2 illustrates two possible outcomes: Figure 2a shows larger oxidation-reduction current peaks centered around +1.35 VRHE. Both β and γ phases are observed. Two additional anodic peaks appear at +1.54 VRHE and +1.65 VRHE in Fe-free electrolytes, along with a decrease in current density at the highest potential (indicating a decrease in OER activity). In contrast, Figure 2b shows Ni foam conditioned in unpurified electrolytes with clear differences. First, a significant increase in OER activity (red arrow, up) controls the region above +1.5 VRHE. The peaks in that region for Figure 2a are no longer observable. A shift in the γ-phase peak is also visible. Thus, CV conditioning can confirm the absence of Fe impurities if the scans resemble those in Figure 2a.
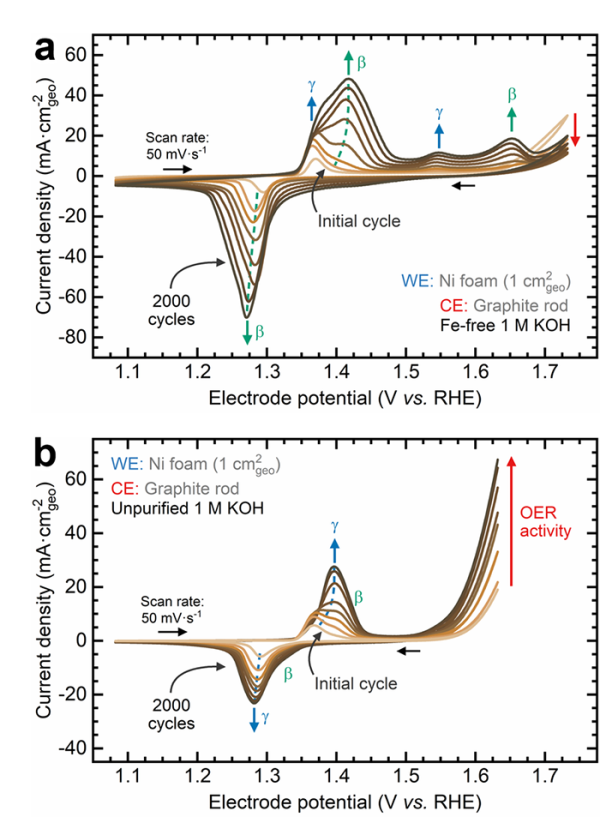
Figure 2: CV scans of Ni foam electrodes in
(a) Fe-free 1 M KOH and (b) unpurified 1 M KOH electrolytes.
Insights from CV Scans
Intermediate scans were also performed at slower scan rates (5 or 1 mV·s⁻¹) to obtain more detailed CV profiles and confirm the presence or absence of Fe impurities. As shown in Figure 3, slower scans reduce the capacitive current observed at faster rates, allowing the β and γ phases to be clearly distinguished. CV scans of Ni electrodes conditioned at slow scan rates can be included in the supplementary materials of OER studies to validate the absence of Fe impurities and compare the activity of OER catalysts.
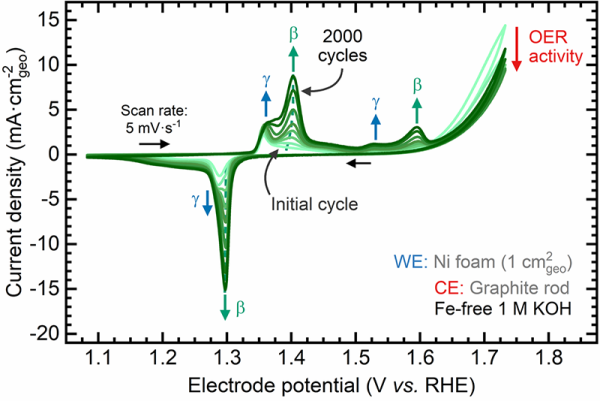
Figure 3: CV scans recorded every 100 cycles during CV conditioning.
The peaks for the β-NiOOH phase and the decrease in OER activity confirm the absence of Fe in the electrolyte.
Gamry Sequence
Figure 4 presents the automated sequence used to generate the results shown here. Once the electrochemical cell is assembled, the sequence is initiated, performing a series of electrochemical steps that involve pre-conditioning, an initial assessment, the conditioning where Fe impurities are incorporated, and the final assessment. At the top of the sequence are convenient variables that are used to tweak the CV/LSV/EIS parameters and the potentiostat settings.
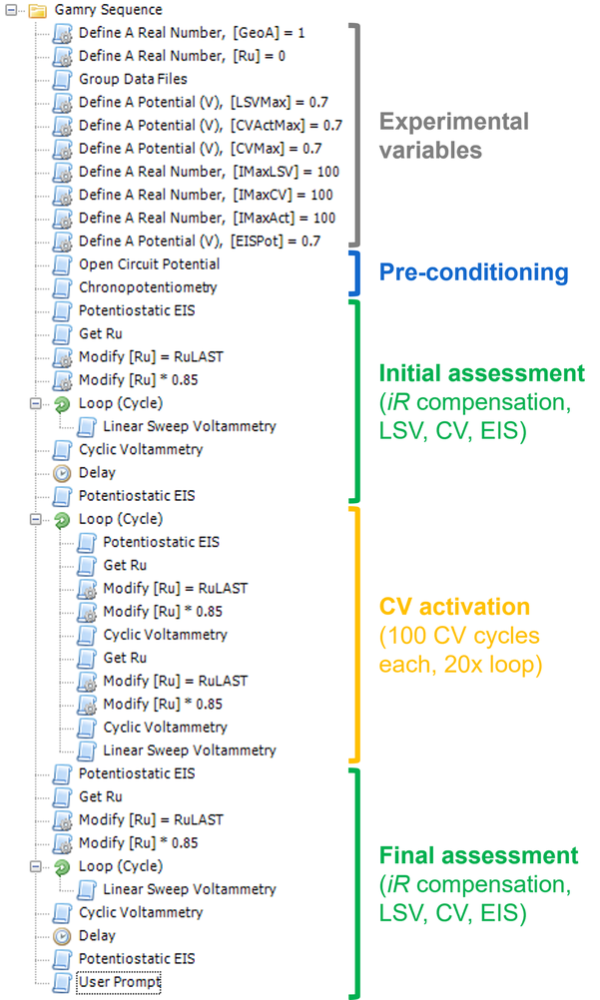
Figure 4: Experimental sequence using Gamry’s sequence wizard
to examine the presence of Fe impurities in alkaline electrolytes for OER studies.
First, an open-circuit potential (OCP) step is run to equilibrate the cell and allow O₂ gas to saturate the electrolyte. Next, a short chronopotentiometry step creates a thin NiOOH layer on the electrode, enhancing its conductivity compared to Ni(OH)₂. Following pre-conditioning, the uncompensated resistance (Ru) is measured (Get Ru), confirmed by a preceding potentiostatic EIS step. 85% of the measured Ru value is used in the LSV and CV immediately following. As mentioned earlier, positive-feedback iR compensation is used in every LSV and CV. See our appnote here for an explanation on iR compensation. Note that potentiostatic EIS provides a check on Ru, which can be ignored unless the Ru value appears suspicious.
Initial assessment includes three repeated LSV scans, two CV scans, and EIS at the vertex potential before CV activation. These serve as the initial characterization to compare to.
CV activation and Fe incorporation is carried out over 2000 cycles, with intermediate LSV and slow-scan CV measurements every 100 cycles. These are the voltammograms shown in Figure 2 and Figure 3.
Lastly, LSV, CV, and EIS measurements are repeated at the end of the activation period to compare with the initial scans.
Conclusion
This application note outlines a simple electrochemical procedure to detect Fe impurities in alkaline electrolytes indirectly. The method employs CV conditioning to accelerate Fe incorporation into Ni foam electrodes, using CV profiles to identify the characteristic effects of Fe impurities on OER activity and Ni oxide/hydroxide phases. Researchers working with OER catalysts in alkaline media or conducting other electrochemical measurements in aqueous alkaline electrolytes are encouraged to adopt this routine to ensure their electrolytes are free of Fe impurities.
References
(1) Márquez, R. A.; Kawashima, K.; Son, Y. J.; Castelino, G.; Miller, N.; Smith, L. A.; Chukwuneke, C. E.; Mullins, C. B. Getting the Basics Right: Preparing Alkaline Electrolytes for Electrochemical Applications. ACS Energy Lett. 2023, 8 (2), 1141–1146. https://doi.org/10.1021/acsenergylett.2c02847.
(2) Son, Y. J.; Marquez, R. A.; Kawashima, K.; Smith, L. A.; Chukwuneke, C. E.; Babauta, J.; Mullins, C. B. Navigating iR Compensation: Practical Considerations for Accurate Study of Oxygen Evolution Catalytic Electrodes. ACS Energy Lett. 2023, 8 (10), 4323–4329. https://doi.org/10.1021/acsenergylett.3c01658.
Want a PDF version of this application note?
Please complete the following form and we will email a link to your inbox!
Categories